Nutrition And Ecology
This project aims to shed some light to the relationship between nutritional value and ecological impact of food. Do we need to compromise between eating healthy and protecting the environment? Are these aspects even related? To respond to our questions, we worked with the Open Food Facts dataset, which lists food products from all over the world, along with many interesting fields such as their manufacturing places, macronutrients or even packaging.
Nutrition Score
How do we know how “healthy” an aliment is?
There are so many (mis)conceptions about health and food, that it is probably impossible to come up with a single universal response.
Instead of coming up with a personal scale of food healthiness, we decided to look at the french government and their Nutri-Score system.
This ranking system uses simple food characteristics such as their energy, fat, sugar and salt composition in order to assess how healthy an aliment is, by attributing it a certain amount of points.
The more points one product has, the least healthy it is considered.
To simplify things even further, the computed points are associated with a letter ranging from A to E, where A represents the best nutritional score and E represents the worst.
(For more details about the nutri-score, do not hesitate to check out our dedicated page.)
We computed the nutri-score for as many products as we could (more than half a million), and we now present the results!
Nutri-Score Visualisation
So we have a lot of data. This is great, but it would be even better if each nutri-score was decently represented. The following plot shows the amount of products for each nutri-score (you can hover over the bars to have the exact number):
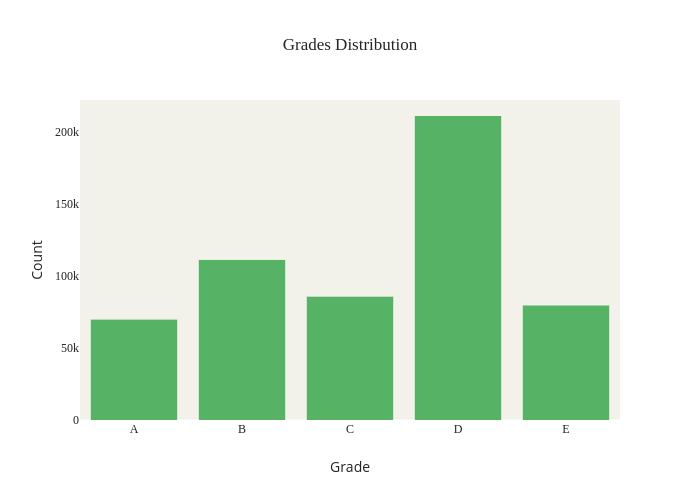
We see that the most represented grade is D. But more importantly, each grade appears significantly, therefore we can continue our analysis without worrying about having too much bias in the grades distribution.
Let’s now take a look at the percentage of grades for different food categories. You can hover over the pie charts below to find the percentage and number of values in each of the slices.
We can see that the Fruits & Vegetables group has great grades (you can see by hovering over its pie chart that almost 75% of its values are either A’s or B’s), whereas the Snacks group has the worst grades - more than 90% are either E or D.
We also notice that the Beverages and Fat & Sauces groups have a significant amount of E’s, which makes sense because of all the sugar one is used to find in most sodas or in populas condiment sauces.
Regarding the Composite category, we see it is reasonably distributed between the grades, with the exception of E’s (not even 1%).
This is due to the difficulty to create a calorical composite meal without any proteins, fibers, fruits, veggies or nuts…
All these observations confort us in the relevance of the Nutri-Score.
Ecological Observations
Now that we got a feeling of the nutritional values distribution per food category, we want to see if there are some correlations between these values and some ecological factors such as the carbon footpring, the packaging materials and the amount of palm oil elements.
Carbon Footprint
The first ecological factor we consider is the carbon footprint. We might wonder what are the food categories that have the biggest carbon foodprints. It is easy to find out by looking at the following barplot that shows the mean carbon footprint per food category:
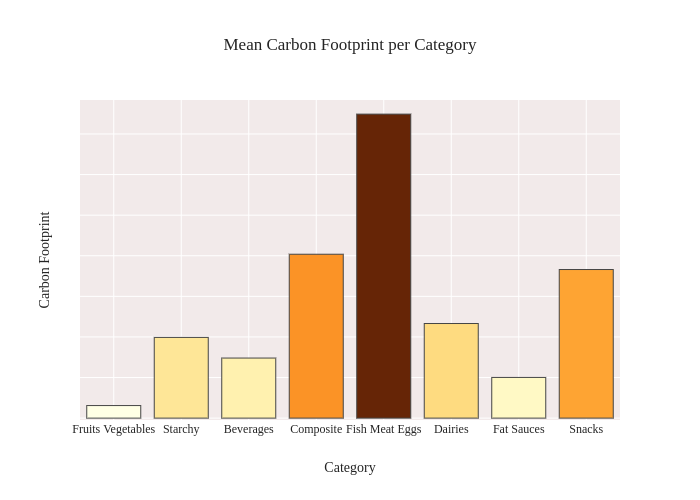
The first thing we notice is how clearly the Fish, Meat & Eggs category stands out as the most carbon-emitting while the Fruits & Vegetables group is by far the least carbon-emitting.
There isn’t much we can say regarding the nutritional values from this plot, so we don’t spend too much time elaborating here.
We just remind the reader that the Snacks category had terrible nutritional scores overall, and now we know that it also has a large carbon footprint.
More on par with our subject is to compare the carbon footprint to the different nutri-score grades. Do the healthiest products produce more or less of a carbon footprint than the least healthy ones? What is the grade that produces the most carbon footprint? What about the one that produces the least? To respond to these question, we now take a look at the following plot, which gives the carbon footprint for each Nutri-Score grade:
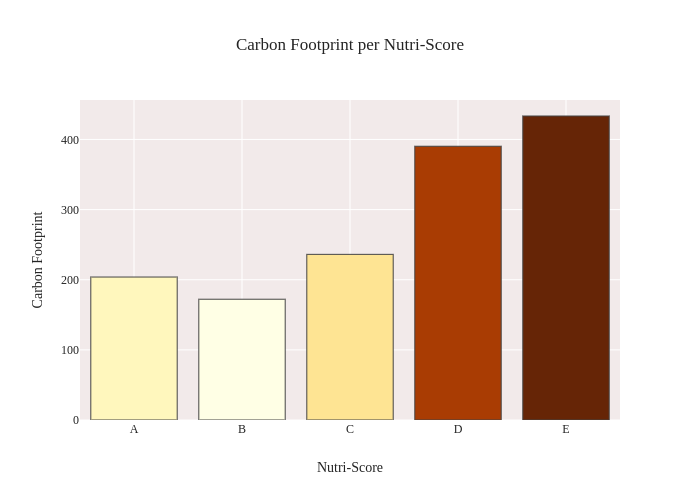
We found something!
There is an obvious trend between the carbon footprint and the nutri-score; the worst the nutri-score gets, the bigger its carbon footprint.
However the A-graded products are not the least carbon emitting.
Indeed, the B-graded products only have 80% of the carbon footprint of the A’s.
By looking back at the Fish, Meat & Eggs pie chart in the Nutri-Score Distribution plot, we can reasonably hypothesise the following: The A’s have worst carbon footprints than the B’s because they are more represented in the most carbon-footprint-heavy category (the Fish, Meat & Eggs one).
In any case, we can now say that eating healthier products means eating less carbon footprint emitting products.
Packaging
We are pretty happy with the last discovery but there are still some other aspects to explore. After the carbon footprint, we now wonder about the packaging that comes with the different Nutri-Scores. Instead of bar charts, we now go back to pie charts (they are more well-timed anyway) corresponding to the five possible nutri-score grades and their packaging type, that can be either:
PlasticpackagingRecyclablepackagingNon-recyclablepackaging
The reason why the Plastic packaging has its own percentage is because it might or might not be recyclable depending on many factors.
Due to its global ecological impact, especially the impact on oceans, this packaging material is highly controversial.
Food industry is among the industries producing the highest amount of plastic.
When it’s made of PET, for beverages bottle, it is recyclable.
But when made from other materials, packaging materials are no longer recyclable especially when in direct contact to food due to chemical contamination.
This part of the analysis shows that this material is still intensively used.
The main point is that generally, the material used contribute to produce non-recyclable wastes and this vital industry for humans has a high scope of improvement while the quality of the food is being improved.
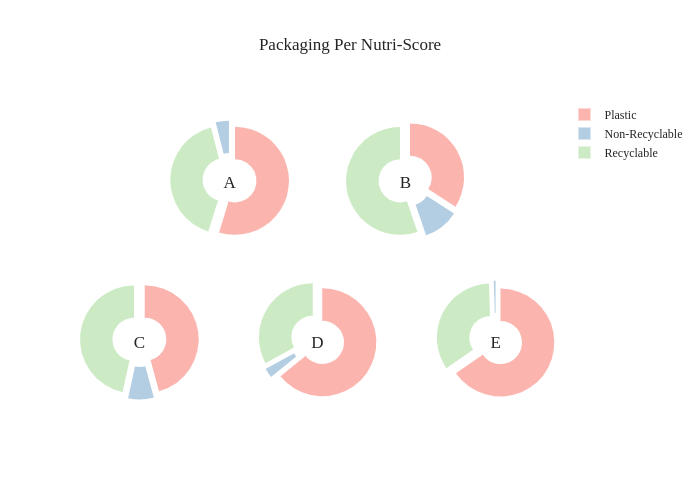
Just by looking at the Recyclable and Non-Recyclable packaging types, there isn’t much one can say without extrapolating ridiculously.
It is clear that the lowest grades (D and E) have the most percentage of plastic packaging, and by looking back at the Mean Carbon Footprint per Category plot, we might guess that this kind of packaging is not recyclable (since in direct contact with food)?
In any case, we can say that there is a lot of room for improvement in this aspect; even the best one (B) only has 55% of its packaging recyclable.
Palm Oil
Palm oil is an ingredient that is used in a lot of products (not only food). Its high usage is paired with a high need of ground for its cultivation. This leads to an immense amount of deforestation which is the source of multiple environmental problems. In order to protect the planet, one might want to reduce its consumption of palm oil, but how does it relate to the healthiness of the food? Let’s see what we can find by looking at the mean number of palm oil elements of each nutri-score grade:
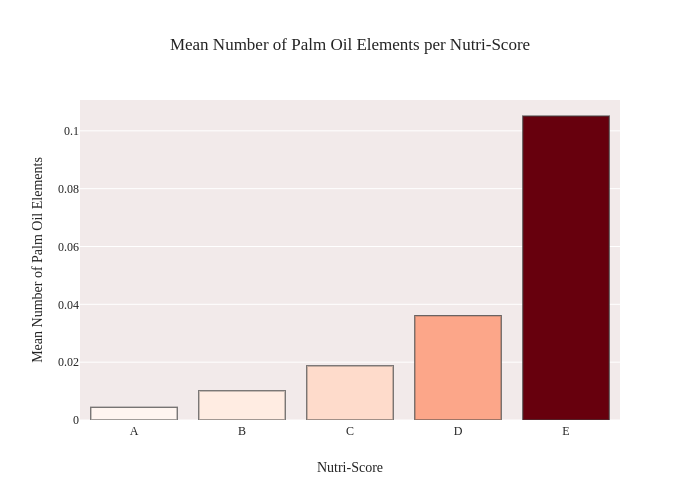
Well…it seems that we found something again.
This time there is no doubt nor exception; the number of palm oil elements increases exponentially as the nutri-score gets worse.
With this new finding, we now wonder what are the food categories that include the most palm oil elements.
Could it be the Fruits & Vegetables? /s
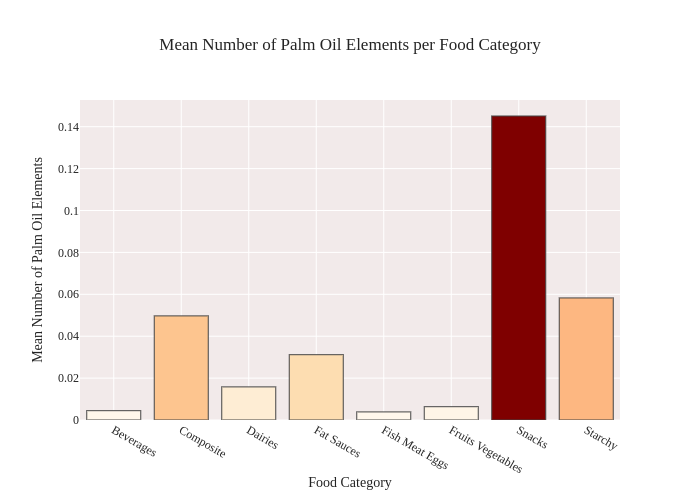
Not really surprisingly, the Snacks category is once again the bad sheep.
It is now the third time, after bad Nutri-Score grades and a big carbon footprint.
Conclusion
Health and ecological consciousness have grown during past years. Appearance of new labels such as nutritional scores or bio are more and more present. The food industry is facing a change especially in Western Europe and the evolution should continue over next years to face the people consciousness. Food is at the center of ecological impacts that can be divided in two segments. The first one is the direct climate change, indeed, One-third of greenhouse gas emissions come from agriculture. Animal based products represent the highest part. The second one is the waste produced by the industry and is linked to the packaging which is actually not fully recyclable. Improvement have been made during the last years with more and more eco-friendly packaging. Many products are still packed with plastic and contribute in its high global production. The issue of next years will be to council the health and ecology in order to produce food that would be not only healthy but also eco-friendly.